Graphy
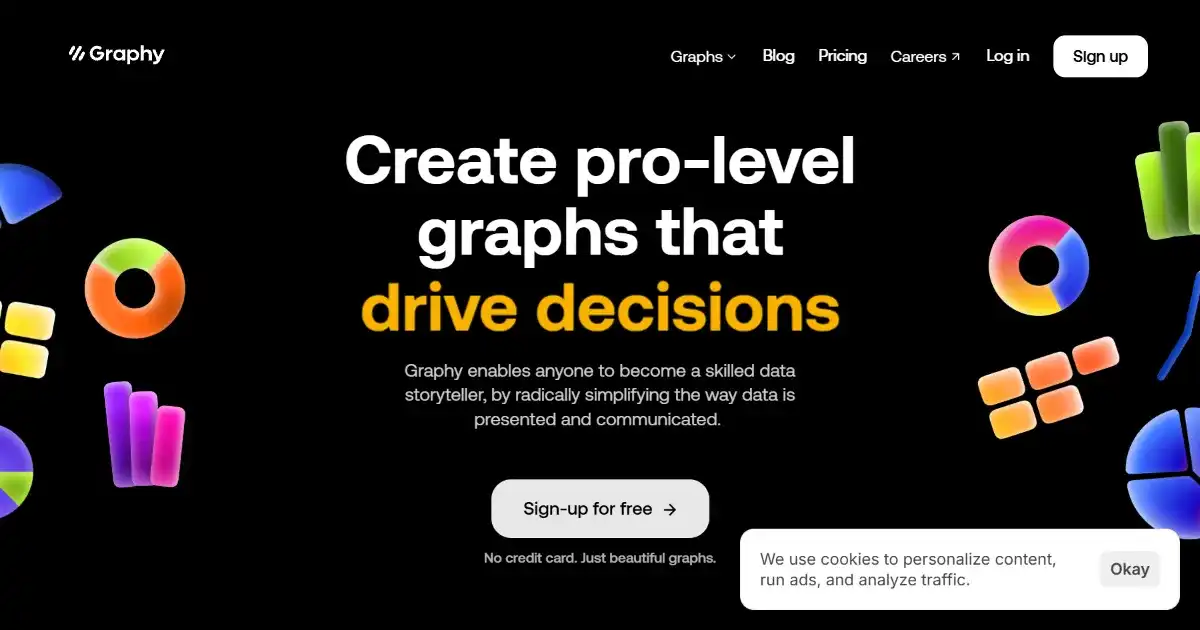
Graphy is an AI-powered data visualization tool that creates interactive graphs and charts. It's designed for professionals who want to easily turn data insights into compelling visuals to tell a clearer story, and improve communication, collaboration, and decision-making.
One translation. Verified by 22 AI models.
Compare leading AI translations, preserve document layouts, and add human verification when accuracy matters.
From idea to 3D model in one browser workspace
Generate from text or images, inspect the result online, then export GLB or OBJ and continue toward an STL workflow.

Create more in one place
Generate images, make videos, edit photos and create audio with shared credits.
Explore MagicShotWhat is Graphy
Graphy is an AI-powered data visualization tool designed for marketers, analysts, business professionals, and anyone who needs to communicate insights effectively. It simplifies turning data into visually engaging graphs and charts. Graphy accelerates creating professional-quality visuals through its interactive interface. It's praised for being quick to learn, requiring minimal technical expertise, enhancing team collaboration and streamlining decision-making based on robust data analysis.
Key Features of Graphy
Graphy is a data visualization tool offering several ways to create impactful, and beautiful data stories.
AI-Powered Chart Suggestions: Graphy suggests suitable chart types based on your data, automating design choices.
Interactive Visualizations: Create dynamic charts that users can explore and interact with.
Easy Data Import: Import data directly from Google Sheets or copy-paste from other sources.
Shareable Outputs: Share your creations as interactive links, embeddable components, or static images.
Collaboration Tools: Facilitate collaborative work on visualizations with your team.
Use Cases of Graphy
Marketing: Create visual representations of campaign data and market trends for reports and presentations.
Sales: Showcase sales data and identify patterns with visually engaging sales graphs.
Business Intelligence: Enhance data understanding and generate insights by quickly creating visual reports and share with stakeholders.
Education: Transform data-driven topics into shareable and engaging materials.
Data Analysis: Analyze various sets of raw data for quicker identification of patterns and potential business values with ease.
Graphy Pros and Cons
Pros
- Easy to use, no technical expertise needed.
- Fast creation of professional quality graphs.
- Enhances team collaboration with easy sharing.
- Clear data visualization for making data-driven decisions.
- Visually appealing charts suitable for presentations and reporting.
Cons
- Limited advanced customization options.
- Integration with a specific set of tools; room for expanding integrations.
- May require a paid subscription for full functionality.
Graphy FAQs
How does the AI in Graphy work?
Graphy uses AI to analyze your data and suggest the most suitable chart types and visualizations. It also automates tasks like choosing color palettes and optimal layouts.
Who is Graphy for?
Graphy is designed for professionals who need to create data visualizations, including marketers, analysts, business professionals, and anyone working with data insights.
Can I import data from my spreadsheet into Graphy?
Graphy integrates seamlessly with Google Sheets, allowing you to directly import your data for visualization. You can also copy and paste data from other spreadsheet applications.
Interested in this product?
Take a look at their websiteUpdated 2026-09-06
Find More Tools

Wondershare.net offers a comprehensive suite of AI-powered tools designed to enhance creativity and productivity across various content formats. From video editing and image generation to audio manipulation and text-to-speech functionalities, Wondershare empowers individuals and businesses to create professional-grade content with ease. Whether you're a content creator, marketer, educator, or simply looking to explore new creative possibilities, Wondershare's AI tools provide the resources you need to elevate your projects to the next level.
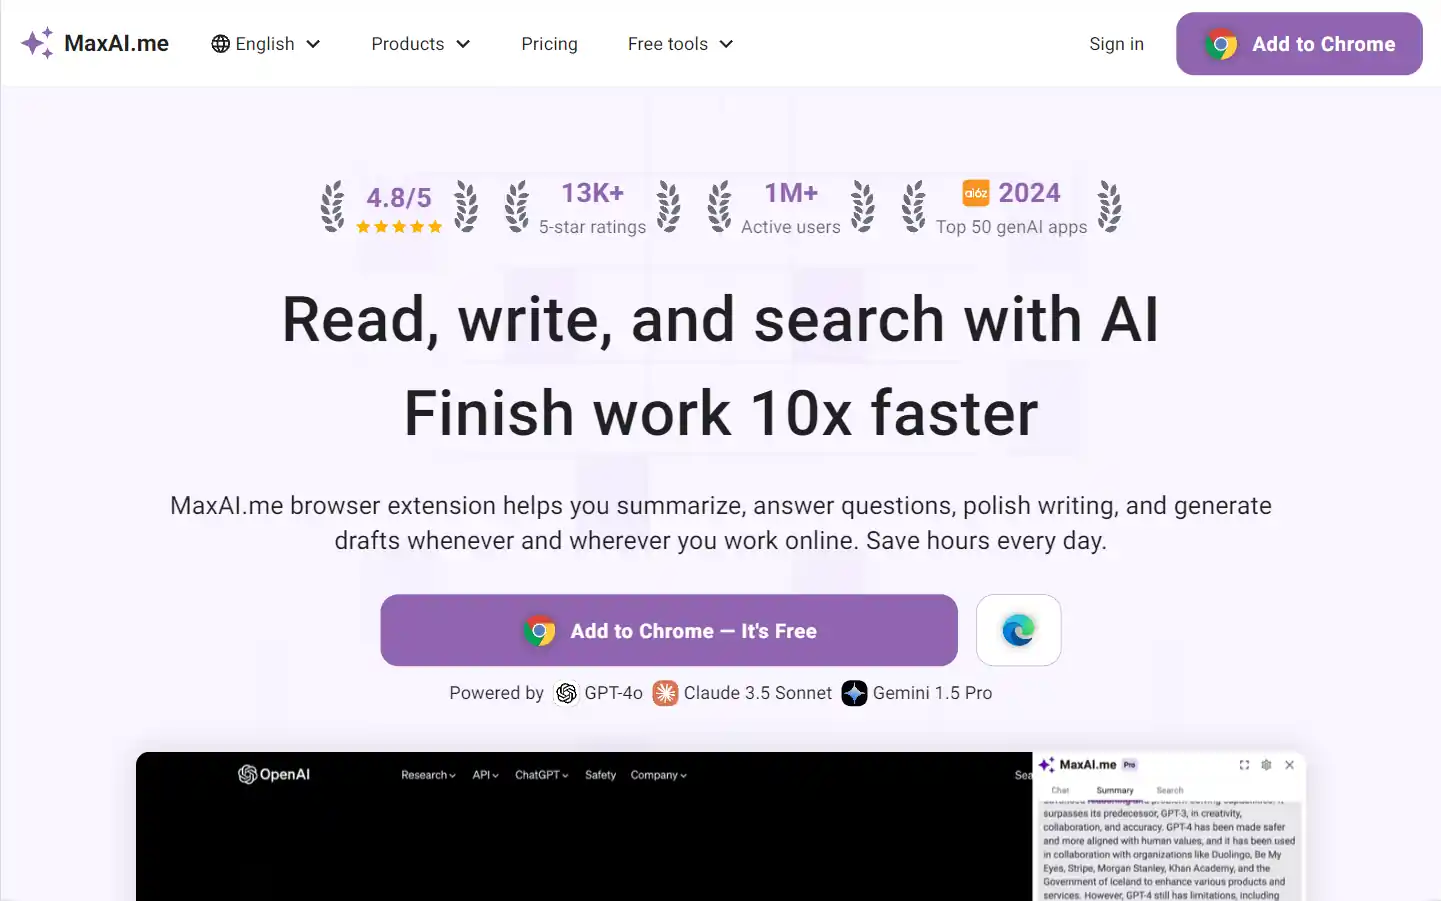
MaxAI.me is a powerful browser extension that provides one-click access to advanced AI models like ChatGPT, Claude, Gemini, and more. It enhances productivity by offering features such as writing improvement, grammar check, summarization, AI chat, and search optimization, all directly on any webpage.
Microsoft Copilot is an AI-driven productivity tool integrated into Microsoft 365 applications, designed to enhance user efficiency and creativity. It assists users by generating content, summarizing information, and providing intelligent suggestions within familiar software environments.
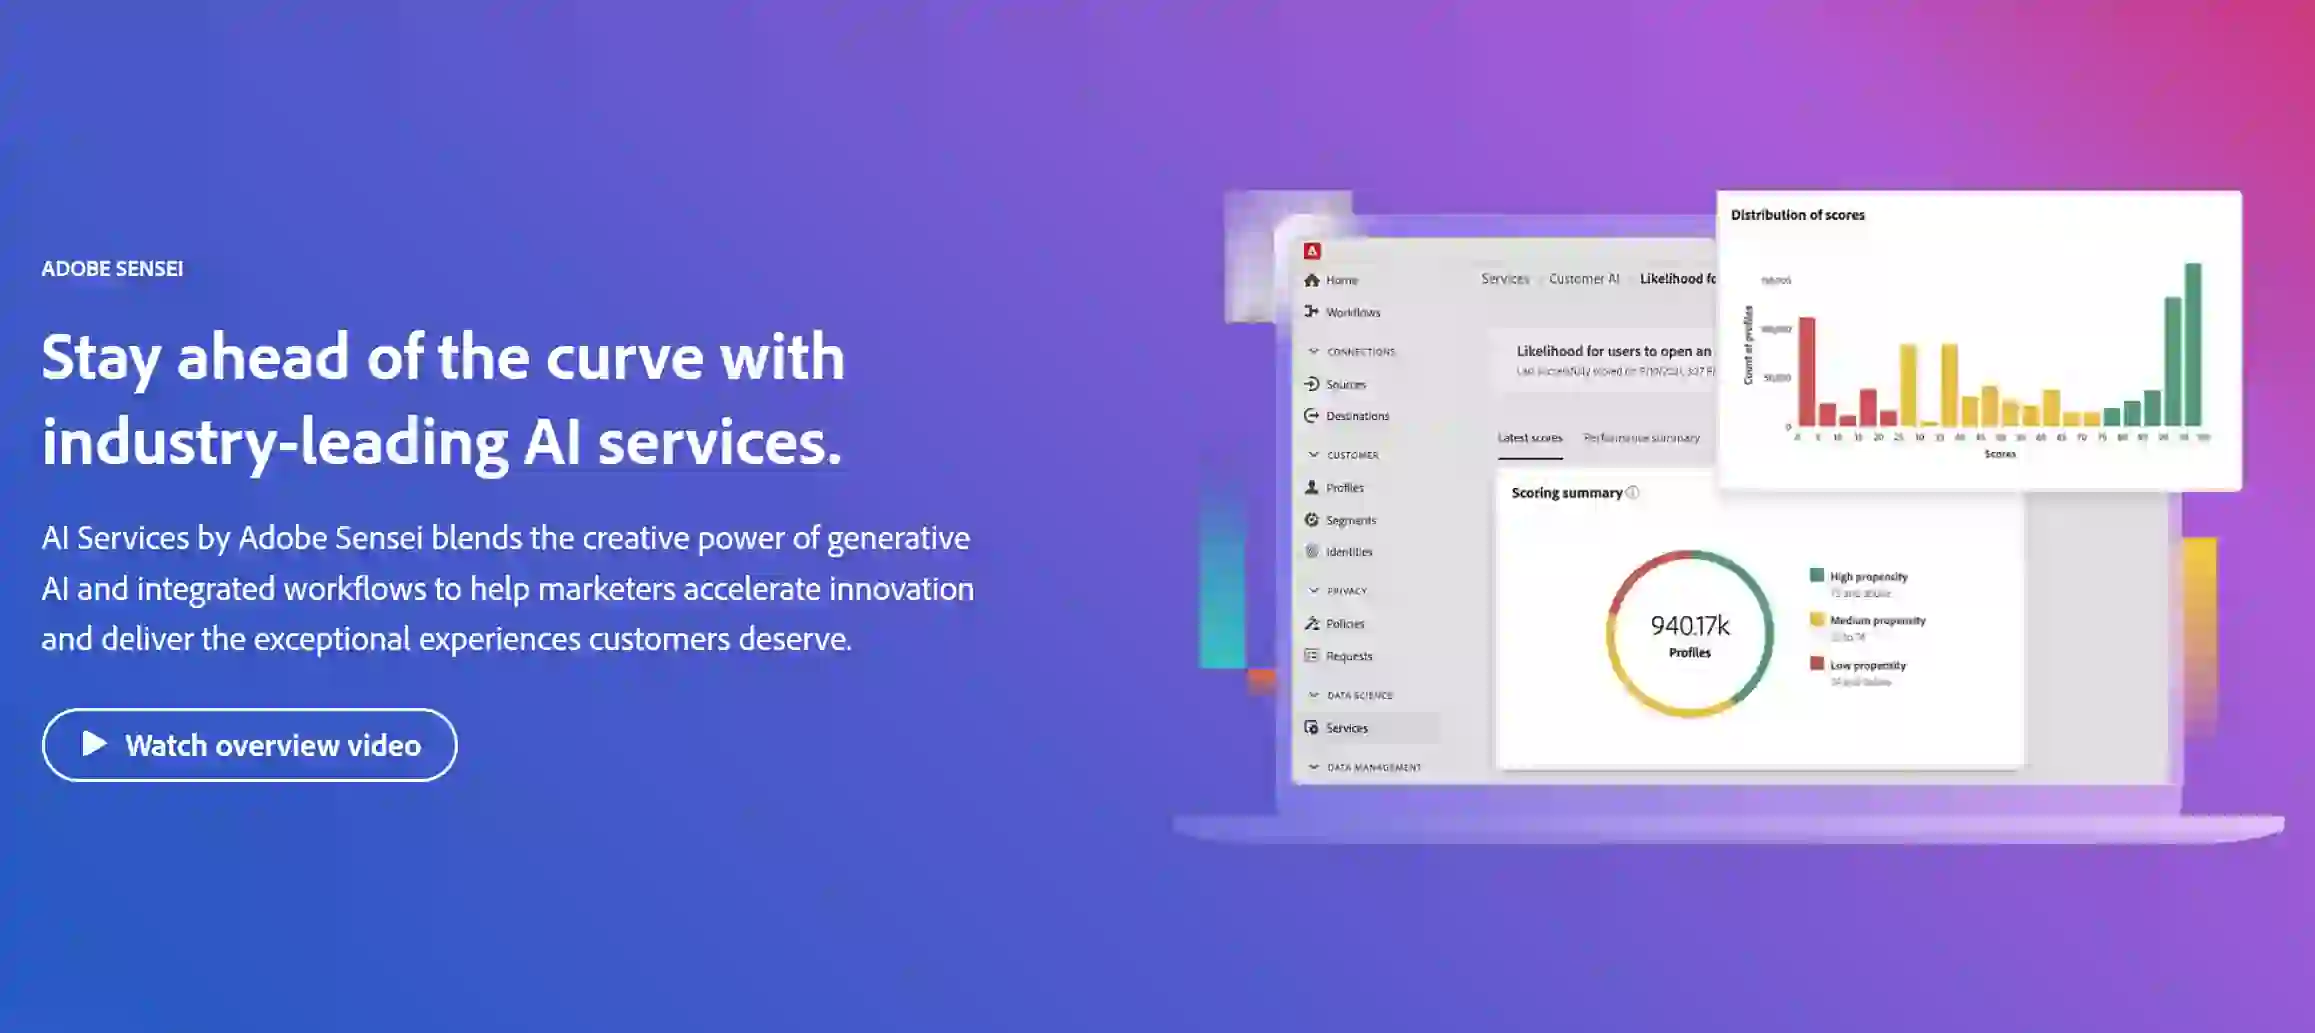
Adobe Sensei is an AI and machine learning platform integrated into Adobe's suite of products. It enhances creative workflows by automating processes, providing intelligent features, and enabling deeper insights through data analysis, making it easier for users to produce high-quality content efficiently.

Google Gemini is an advanced AI model designed to enhance various applications by integrating natural language processing and image understanding capabilities. It aims to improve user interactions across Google's platforms, providing more intuitive and context-aware responses.

ChatInsight.AI is an AI-driven analytics platform designed to enhance customer interactions by providing deep insights into conversational data. It leverages natural language processing to analyze chat logs, helping businesses understand customer behavior and improve engagement strategies.